.png?width=60&name=image%20(62).png)

Your brand is on Twitter and publishing content regularly. And you’ve even set aside a budget to manage the platform, with a well-defined strategy that works…or at least seems to work. But how can you know for sure unless you look at the data? More importantly, you need data to understand what’s working and what’s not so you can adjust your strategy for even greater impact.
In this post, we take a closer look at how to analyse Twitter data and extract valuable insights that will help you grow your brand presence on the platform. Let’s get started.
What is Twitter data?
Twitter data refers to any user or account-related information generated on the platform. It can include broader, account-specific information such as following size and audience demographics. But it can also get more granular with information related to a single tweet such as reach and engagement.
Why is Twitter data analysis important for businesses?
A detailed Twitter data analysis can have many benefits for businesses and help shape different aspects of your marketing - from brand positioning to PR and content strategy. With the valuable data insights that you get from your analysis, you can:
- Measure the effectiveness of current campaigns/strategies based on how people are responding.
- Know what kind of content resonates with your audience based on tweet-specific engagement data.
- Look for opportunities to optimise by understanding what’s working and what’s not. Are there any content types or approaches that see much lower engagement or high levels of negative comments? Is your audience responding far better to a specific type of content or approach?
- Discover your most engaged audience segments so you know whom to target for future campaigns and paid ads. This will help you focus your resources on people who are most likely to deliver value.
- Benchmark your performance against competitors. See exactly where you stand compared to your competitors and look for any gaps in your existing strategy.
What data does Twitter collect?
Twitter collects a wealth of tweet and account-related data, which you can access through its native analytics tool. You can access this by clicking on the “More” button from the left-hand panel of your screen and then selecting “Analytics.”

From here, you can gain access to a vast array of data collected by Twitter:
Tweet volume
In the “Account home” page, Twitter gives you an overview of how many tweets you made over the past 28 days. It also displays data about how your tweet volume has changed since the previous period.

Tweet impressions
The same page also gives you an overview of your total tweet impressions as well as the change in volume compared to the previous period. To get a more detailed breakdown of how your tweet impressions have changed day by day, scroll down to the month-wise data breakdown and click on the “View all Tweet activity” button.

This will open up a page showing a detailed breakdown of all your tweet activity, with impression data highlighted at the top. You can see a bar graph showcasing the daily changes in impression during a 28-day period. On the right-hand panel, Twitter will also show you how many impressions you earned on average each day.

If you scroll further down, you can also get tweet-wise impression data, allowing you to see which tweets gained the most impressions.
Tweet engagement
From the “Tweet activity” page, you can view your tweet engagement data. Twitter provides a detailed breakdown of the total engagements and the engagement rate of each tweet. This will give you an idea of which tweets gained the most engagement. On the right-hand panel, you can also view the average engagement rate over a 28-day period.

From the same right-hand panel, you can view other engagement-related data such as likes, replies, and retweets. Twitter will show you both the total volumes and the average volume per day.

Top tweets
One of the most useful data points is the breakdown of your top tweets. Twitter will show you which of your tweets were the most successful based on factors like impressions, total engagements, and engagement rate. This can give you an idea of the types of posts that most resonate with your audience so you can leverage them in your Twitter content strategy.
Profile visits
Twitter also collects data about how many people visited your profile during the same 28-day period. Next to the total volume, you can see how those visits have either fallen or increased compared to the previous period.

Mentions
You can also access data about how many mentions you received over the past 28 days along with information about how the volume has changed compared to the previous period. Twitter will even highlight the top mention for each month and how much engagement it received.

Followers
The Twitter analytics dashboard provides you with info about the total followers you have as well as how many you gained during the same 28-day period. For each month, it collects info about the number of new followers you gained (or lost).

Link clicks
If you’ve shared links in your tweets, you can also view the number of clicks you received for those links. From the right-hand panel of your “Tweet activity” page, you can get a daily breakdown of link clicks and average link clicks per day.

Audience insights
Besides tweet activity, the native Twitter analytics dashboard can also be used to provide audience insights. This allowed users to gain more in-depth insights about their followers such as demographic profiles, device usage data, interests, lifestyle, and purchase behaviour.
But in January 2020, Twitter announced that they will no longer be providing access to this data and didn’t specify why or whether there’d be any tool to replace it in the near future.
Using Audiense to analyse Twitter data
Although you can no longer gain access to audience-related data from the native Twitter analytics tool, there are other ways to analyse audience data on Twitter. The Audiense Connect platform comes with robust tools that you can use to complement the free built-in analytics tool from Twitter and gain more comprehensive data about your audience.
Here are a few ways Audiense Connect can help you analyse Twitter data:
Analyse your content
Audiense Connect comes with a Tweet Analytics tool to expand upon the insights from your native Twitter analytics. This dashboard will provide you with a comprehensive breakdown of your tweet performance in terms of how people are interacting with it, the kind of engagement it gets, and which users engaged with it.

Understand your community
What’s great about Audiense Connect is that you can use it to replace the now-discontinued Twitter Audience Insights. The platform provides you with detailed insights into your community, going beyond follower growth.
You can use the Community widgets to view details like which users you influence, which of your followers are highly active, which of your followers have verified accounts, and which followers are influential.
The dashboard also lets you view the country-wise distribution and primary languages of your followers so you can understand at which geographic locations you have the most impact.

Benchmark your performance against competitors
The Audiense Connect platform gives you comprehensive insights into the accounts of your top competitors. The Account Comparison feature will let you analyse and compare the stats for up to three different accounts. From the report, you’ll be able to compare follower and following sizes, total number of tweets, and tweets per day.
You can also visualise the data in a bar graph to easily assess your community size. The feature lets you make an even more detailed comparison by analysing intersecting audiences, languages, locations, verified status, and many more.

Optimise your audience targeting
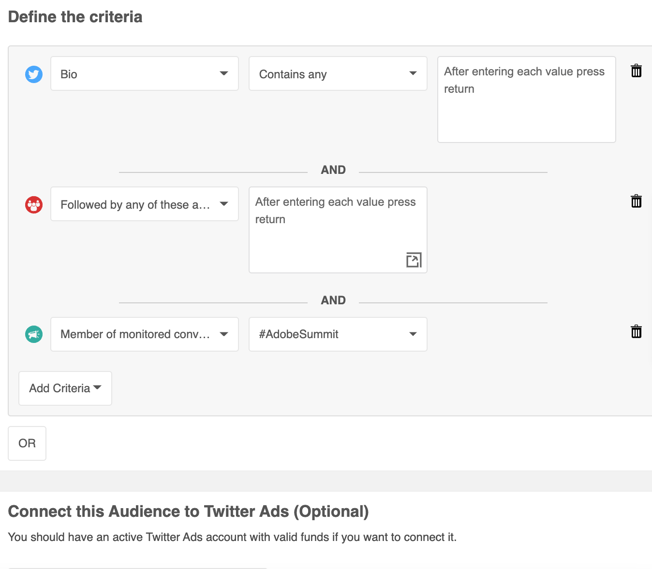
Audiense Connect comes with robust audience targeting features so you can improve the relevancy of your Twitter advertising efforts. The Advanced Audience Manager lets you create customised audience based on different triggers like whether they follow or unfollow an account or engage with the account in any way.
You can also create dynamic audiences based on different categories like profile details, behaviour, conversations, personality insights, demographics, and relationships. This lets you build highly accurate audiences that you can use in your campaign targeting.
You can also create dynamic audiences based on different categories like profile details, behaviour, conversations, personality insights, demographics, and relationships. This lets you build highly accurate audiences that you can use in your campaign targeting.
Discover the best time to tweet
Audiense Connect further enables you to optimise your Twitter strategy by analysing the best time to tweet. And it doesn’t just stop at giving you a default report for your community as a whole; you can even create custom reports for individual users and specific audience groups. That means you can build an audience segment based on shared criteria and analyse the best time to engage this specific segment.

Getting started with Twitter data analysis using Audiense
The built-in Twitter analytics tool already provides you with great insights about your tweet performance. But it can only tell you so much about your audience – such as what interests tie them together, who influences them, or which languages they speak.
Since Twitter no longer offers Audience Insights, you need a platform like Audiense Connect to extract more robust insights about your audience. To start your in-depth Twitter data analysis, sign up to create your Audiense account.